go profile
簡介
Go語言的性能分析工具pprof是Google C++ profiler的移植,非常有趣。
cpu profile
If the code used the Go testing package’s benchmarking support, we could use gotest’s standard -cpuprofile and -memprofile flags. In a standalone program like this one, we have to import runtime/pprof and add a few lines of code:
import "runtime/pprof" var cpuprofile = flag.String("cpuprofile", "", "write cpu profile to file")
func main() {
flag.Parse() if *cpuprofile != "" {
f, err := os.Create(*cpuprofile) if err != nil {
log.Fatal(err)
}
pprof.StartCPUProfile(f)
defer pprof.StopCPUProfile()
} ...
履行程序,同時指定-cpuprofile flag,生成profile文件,我們的go程序的binary是go_cpu_pro:
$ ./xtime ./go_cpu_pro -cpuprofile=cpu.prof
Welcome to LoopTesterApp, Go edition
Constructing Simple CFG... 15000 dummy loops
Constructing CFG...
Performing Loop Recognition 1 Iteration
Another 50 iterations...
.................................................. # of loops: 76001 (including 1 artificial root node) 61.42u 0.26s 36.75r 499900kB ./go_cpu_pro -cpuprofile=cpu.prof
運行go tool pprof解釋生成的profile,同時進入pprof環境后,可以用help命令查看幫助信息,最經常使用的命令如top10,可以看最耗時的function:
$ go tool pprof go_cpu_pro cpu
.prof Entering interactive mode (type
"help" for commands)
(pprof) top10
39.14s of
51.11s total (
76.58%)
Dropped
110 nodes (cum <=
0.26s)
Showing top
10 nodes
out of
66 (cum >=
1.20s)
flat flat% sum% cum cum%
9.83s
19.23%
19.23%
20.55s
40.21% runtime
.scanobject 6.32s
12.37%
31.60%
6.32s
12.37% runtime
.heapBitsForObject 4.16s
8.14%
39.74%
26.88s
52.59% github
.com/hundt98847/multi_lang_bench_go/havlakloopfinder
.FindLoops 3.79s
7.42%
47.15%
10.88s
21.29% runtime
.mallocgc 3.72s
7.28%
54.43%
4.08s
7.98% runtime
.mapaccess1_fast64
3.62s
7.08%
61.51%
4.75s
9.29% runtime
.greyobject 3.18s
6.22%
67.74%
8.02s
15.69% runtime
.mapassign1
2.10s
4.11%
71.85%
2.16s
4.23% runtime
.heapBitsSetType 1.22s
2.39%
74.23%
1.22s
2.39% runtime/internal/atomic
.Or8
1.20s
2.35%
76.58%
1.20s
2.35% runtime
.memclr
當CPU profiling開啟時,Go程序每秒采樣大約100次,1個采樣由在當前正在履行的goroutine的堆棧上的程序計數器組成,這個profile有51.11*100=51110次采樣,總時間是51.11s,在go tool pprof的輸出中,每行是1個function,各列的含義順次是:
-
采樣點落在該函數中的次數
-
采樣點落在該函數中的百分比
-
上1項的積累百分比
-
采樣點落在該函數,和被它調用的函數中的總次數
-
采樣點落在該函數,和被它調用的函數中的總次數百分比
-
函數名
To sort by the fourth and fifth columns, use the -cum (for cumulative) flag:
(pprof) top10 -cum 18.72s of 51.11s total (36.63%)
Dropped 110 nodes (cum <= 0.26s)
Showing top 10 nodes out of 66 (cum >= 9.21s)
flat flat% sum% cum cum% 0 0% 0% 46.38s 90.75% runtime.goexit 0 0% 0% 27.31s 53.43% main.main 0 0% 0% 27.31s 53.43% runtime.main 0 0% 0% 26.88s 52.59% github.com/hundt98847/multi_lang_bench_go/havlakloopfinder.FindHavlakLoops 4.16s 8.14% 8.14% 26.88s 52.59% github.com/hundt98847/multi_lang_bench_go/havlakloopfinder.FindLoops 9.83s 19.23% 27.37% 20.55s 40.21% runtime.scanobject 0 0% 27.37% 18.59s 36.37% runtime.gcBgMarkWorker 0.52s 1.02% 28.39% 18.59s 36.37% runtime.gcDrain 3.79s 7.42% 35.81% 10.88s 21.29% runtime.mallocgc 0.42s 0.82% 36.63% 9.21s 18.02% runtime.newobject
我們還可使用web指令生成函數調用關系圖,web命令會生成1個SVG格式的圖片,我們需要預先安裝graphviz,Ubuntu上我們可以用sudo apt-get install graphviz
(pprof) web
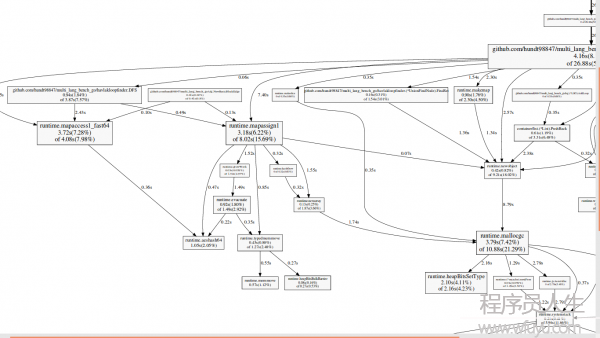
圖片中,每一個box是1個function,并且依照該function運行的采樣數改變box的尺寸,從X到Y的1條邊代表著X calls Y,Edge上面的數字是這個調用出現在1個采樣的次數。例如:runtime.mapaccess1_fast64 3.72s(7.28%) of 4.08s(7.98%),其中3.72s表示全部采樣中,有3.72*100次runtime.mapaccess1_fast64正在運行,4.08s表示全部采樣中,有4.08*100次堆棧中包括runtime.mapaccess1_fast64,runtime.mapaccess1_fast64到runtime.aeshash64那條邊表示函數調用,上面的數字0.36s表示,全部采樣中唯一0.36*100次采樣捕捉到了runtime.mapaccess1_fast64對runtime.aeshash64的調用。
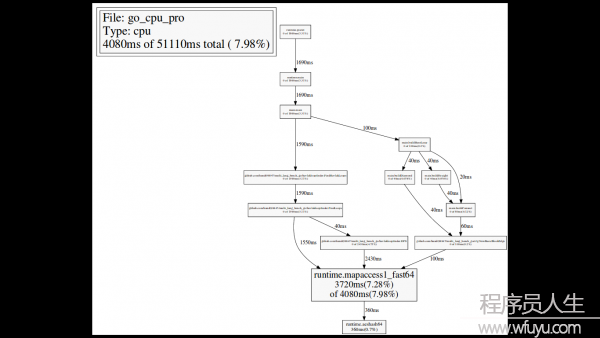
我們還可使用web指令,僅查看某個function的調用關系圖,例如runtime.mapaccess1_fast64:
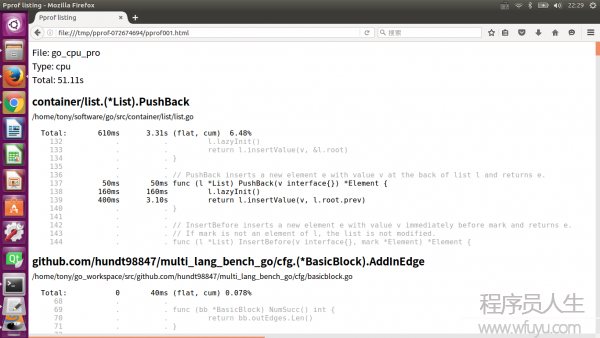
查看函數內,每行代碼的采樣數:
(pprof) list DFS Total: 51.11s ROUTINE ======================== github.com/hundt98847/multi_lang_bench_go/havlakloopfinder.DFS in /home/tony/go_workspace/src/github.com/hundt98847/multi_lang_bench_go/havlakloopfinder/havlakloopfinder.go 940ms 7.68s (flat, cum) 15.03% of Total . . 155: return false . . 156:}
. . 157: . . 158:// DFS - Depth-First-Search and node numbering.
. . 159:// 10ms 10ms 160:func DFS(currentNode *cfg.BasicBlock, nodes []*UnionFindNode, number map[*cfg.BasicBlock]int, last []int, current int) int { 40ms 50ms 161: nodes[current].Init(currentNode, current) 40ms 530ms 162: number[currentNode] = current
. . 163: . . 164: lastid := current 250ms 250ms 165: for ll := currentNode.OutEdges().Front(); ll != nil; ll = ll.Next() { 350ms 1.99s 166: if target := ll.Value.(*cfg.BasicBlock); number[target] == unvisited { 60ms 3.87s 167: lastid = DFS(target, nodes, number, last, lastid+1)
. . 168: }
. . 169: } 150ms 940ms 170: last[number[currentNode]] = lastid 40ms 40ms 171: return lastid
. . 172:}
. . 173: . . 174:// FindLoops . . 175:// . . 176:// Find loops and build loop forest using Havlak's algorithm, which
The listing shows the source code for the DFS function (really, for every function matching the regular expression DFS). The first three columns are the number of samples taken while running that line, the number of samples taken while running that line or in code called from that line, and the line number in the file. The related commanddisasmshows a disassembly of the function instead of a source listing; when there are enough samples this can help you see which instructions are expensive. Theweblistcommand mixes the two modes:it shows a source listing in which clicking a line shows the disassembly.
(pprof) weblist
some hints
Here are some hints with respect to how to interpret what you see in the profile.
If you see lots of time spent in runtime.mallocgc function, the program potentially makes excessive amount of small memory allocations. The profile will tell you where the allocations are coming from. See the memory profiler section for suggestions on how to optimize this case.
If lots of time is spent in channel operations, sync.Mutex code and other synchronization primitives or System component, the program probably suffers from contention. Consider to restructure program to eliminate frequently accessed shared resources. Common techniques for this include sharding/partitioning, local buffering/batching and copy-on-write technique.
If lots of time is spent in syscall.Read/Write, the program potentially makes excessive amount of small reads and writes. Bufio wrappers around os.File or net.Conn can help in this case.
If lots of time is spent in GC component, the program either allocates too many transient objects or heap size is very small so garbage collections happen too frequently. See Garbage Collector Tracer and Memory Profiler sections for optimization suggestions.
如果大量的時間消耗在runtime.mallocgc的函數,那末暗示程序產生了大量過度的小內存分配工作。查看內存分析器部份可以取得如何優化這類情況的建議。
如果大量的時間消耗在channel operations, sync.Mutex code and other synchronization primitives or System component,那末程序極可能正在飽受資源競爭的痛苦。
如果大量的時間消耗在syscall.Read/Write,那末暗示程序產生了大量過度的小塊讀寫。對這類情況,Bufio會很有幫助。
如果大量的時間消耗在GC component,那末程序或分配了大量短暫的對象,或堆size太小了。
memory profile
與cpu profile相同,memory profile也需要導入runtime/pprof,同時增加1些代碼:
import "runtime/pprof" var memprofile = flag.String("memprofile", "", "write memory profile to this file") ... FindHavlakLoops(cfgraph, lsgraph) if *memprofile != "" {
f, err := os.Create(*memprofile) if err != nil {
log.Fatal(err)
}
pprof.WriteHeapProfile(f)
f.Close() return }
履行程序,同時指定-memprofile flag,生成profile文件,我們的go程序的binary是go_mem_pro:
$ ./xtime ./go_mem_pro -memprofile=mem.prof
Welcome to LoopTesterApp, Go edition
Constructing Simple CFG... 15000 dummy loops
Constructing CFG... Performing Loop Recognition 1 Iteration 2.31u 0.12s 1.41r 263852kB ./go_mem_pro -memprofile=mem.prof
運行go tool pprof解釋生成的profile,進入pprof環境:
$ go tool pprof go_mem_pro mem.prof Entering interactive mode (type "help" for commands)
(pprof) top10 108.34MB of 108.34MB total ( 100%)
Dropped 2 nodes (cum <= 0.54MB)
Showing top 10 nodes out of 13 (cum >= 32MB)
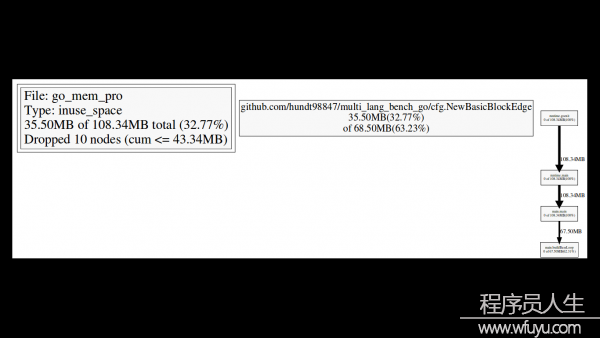
flat flat% sum% cum cum% 39.84MB 36.77% 36.77% 39.84MB 36.77% github.com/hundt98847/multi_lang_bench_go/havlakloopfinder.FindLoops 35.50MB 32.77% 69.54% 68.50MB 63.23% github.com/hundt98847/multi_lang_bench_go/cfg.NewBasicBlockEdge 33MB 30.46% 100% 33MB 30.46% container/list.(*List).PushBack 0 0% 100% 15MB 13.85% github.com/hundt98847/multi_lang_bench_go/cfg.(*BasicBlock).AddInEdge 0 0% 100% 18MB 16.62% github.com/hundt98847/multi_lang_bench_go/cfg.(*BasicBlock).AddOutEdge 0 0% 100% 39.84MB 36.77% github.com/hundt98847/multi_lang_bench_go/havlakloopfinder.FindHavlakLoops 0 0% 100% 67.50MB 62.31% main.buildBaseLoop 0 0% 100% 36.50MB 33.69% main.buildConnect 0 0% 100% 32MB 29.54% main.buildDiamond 0 0% 100% 32MB 29.54% main.buildStraight
現在這個采樣是內存分配, not clock ticks. To find the memory allocations, we can list those functions.
(pprof) list FindLoops
Total: 108.34MB
ROUTINE ======================== github.com/hundt98847/multi_lang_bench_go/havlakloopfinder.FindLoops in /home/tony/go_workspace/src/github.com/hundt98847/multi_lang_bench_go/havlakloopfinder/havlakloopfinder.go 39.84MB 39.84MB (flat, cum) 36.77% of Total
. . 183: return . . 184: }
. . 185:
. . 186: size := cfgraph.NumNodes()
. . 187: 1.97MB 1.97MB 188: nonBackPreds := make([]map[int]bool, size) 11.54MB 11.54MB 189: backPreds := make([]list.List, size)
. . 190:
. . 191: number := make(map[*cfg.BasicBlock]int) 1.97MB 1.97MB 192: header := make([]int, size, size) 1.97MB 1.97MB 193: types := make([]int, size, size) 1.97MB 1.97MB 194: last := make([]int, size, size) 1.97MB 1.97MB 195: nodes := make([]*UnionFindNode, size, size)
. . 196:
. . 197: for i := 0; i < size; i++ { 11.50MB 11.50MB 198: nodes[i] = new(UnionFindNode)
. . 199: }
. . 200:
. . 201: . . 202: . . 203: . . 204: . . 205: . . 206: for i, bb := range cfgraph.BasicBlocks() { 5.44MB 5.44MB 207: number[bb] = unvisited 1.50MB 1.50MB 208: nonBackPreds[i] = make(map[int]bool)
. . 209: }
. . 210:
. . 211: DFS(cfgraph.StartBasicBlock(), nodes, number, last, 0)
. . 212:
. . 213: . . 214: . . 215: . . 216:
順便說1句, 假設我們運行go tool pprof與--inuse_objectsflag, it will report allocation counts instead of sizes:
$ go tool pprof --inuse_objects go_mem_pro mem.prof Entering interactive mode (type "help" for commands)
(pprof) top10 1381266 of 1381266 total ( 100%)
Dropped 2 nodes (cum <= 6906)
Showing top 10 nodes out of 13 (cum >= 371389)
flat flat% sum% cum cum% 720918 52.19% 52.19% 720918 52.19% container/list.(*List).PushBack 413266 29.92% 82.11% 413266 29.92% github.com/hundt98847/multi_lang_bench_go/havlakloopfinder.FindLoops 247082 17.89% 100% 968000 70.08% github.com/hundt98847/multi_lang_bench_go/cfg.NewBasicBlockEdge 0 0% 100% 327690 23.72% github.com/hundt98847/multi_lang_bench_go/cfg.(*BasicBlock).AddInEdge 0 0% 100% 393228 28.47% github.com/hundt98847/multi_lang_bench_go/cfg.(*BasicBlock).AddOutEdge 0 0% 100% 413266 29.92% github.com/hundt98847/multi_lang_bench_go/havlakloopfinder.FindHavlakLoops 0 0% 100% 946154 68.50% main.buildBaseLoop 0 0% 100% 469696 34.00% main.buildConnect 0 0% 100% 498304 36.08% main.buildDiamond 0 0% 100% 371389 26.89% main.buildStraight
還有,我們可使用–nodefraction=0.1 告知go tool pprof忽視掉低于10%的采樣的box,固然數字我們是可以改的,下面是2次修改nodefraction的對照:
$ go tool pprof Entering interactive mode (type "help" for commands)
(pprof) web
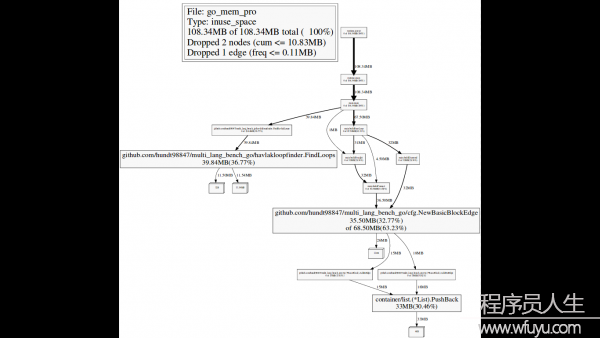
$ go tool pprof Entering interactive mode (type "help" for commands)
(pprof) web
heap profile
package main
import ( "fmt" "os" "runtime/pprof" )
func main() {
fmt.Println("--lookup heap---------------")
p4heap := pprof.Lookup("heap")
p4heap.WriteTo(os.Stdout, 1)
}
heap profile: 4: 266528 [123: 11284472] @ heap/1048576 1: 262144 [4: 376832] @ 0x28d9f 0x2a201 0x2a28a 0x2624d 0x26188 0x94ca3 0x94a0b 0x17add6 0x17ae9f 0x1069d3 0xfe911 0xf0a3e 0xf0d22 0x21a70 # 0x2a201 cnew+0xc1 runtime/malloc.goc:718 # 0x2a28a runtime.cnewarray+0x3a runtime/malloc.goc:731 # 0x2624d makeslice1+0x4d runtime/slice.c:57 # 0x26188 runtime.makeslice+0x98 runtime/slice.c:38 # 0x94ca3 bytes.makeSlice+0x63 bytes/buffer.go:191 # 0x94a0b bytes.(*Buffer).ReadFrom+0xcb bytes/buffer.go:163 # 0x17add6 io/ioutil.readAll+0x156 io/ioutil/ioutil.go:32 # 0x17ae9f io/ioutil.ReadAll+0x3f io/ioutil/ioutil.go:41 # 0x1069d3 godoc/vfs.ReadFile+0x133 godoc/vfs/vfs.go:44 # 0xfe911 godoc.func·023+0x471 godoc/meta.go:80 # 0xf0a3e godoc.(*Corpus).updateMetadata+0x9e godoc/meta.go:101 # 0xf0d22 godoc.(*Corpus).refreshMetadataLoop+0x42 godoc/meta.go:141 2: 4096 [2: 4096] @ 0x28d9f 0x29059 0x1d252 0x1d450 0x106993 0xf1225 0xe1489 0xfbcad 0x21a70 # 0x1d252 newdefer+0x112 runtime/panic.c:49 # 0x1d450 runtime.deferproc+0x10 runtime/panic.c:132 # 0x106993 godoc/vfs.ReadFile+0xf3 godoc/vfs/vfs.go:43 # 0xf1225 godoc.(*Corpus).parseFile+0x75 godoc/parser.go:20 # 0xe1489 godoc.(*treeBuilder).newDirTree+0x8e9 godoc/dirtrees.go:108 # 0xfbcad godoc.func·002+0x15d godoc/dirtrees.go:100
The numbers in the beginning of each entry (“1: 262144 [4: 376832]”) represent number of currently live objects, amount of memory occupied by live objects, total number of allocations and amount of memory occupied by all allocations, respectively.
每一個條目開頭的數字(”1: 262144 [4: 376832]”)分別表示目前存活的對象,存活對象占據的內存, 分配對象的個數和所有分配對象占據的內存總量。
block profile
package main
import ( "fmt" "os" "runtime/pprof" )
func main() {
fmt.Println("--lookup block--------------")
p4block := pprof.Lookup("block")
p4block.WriteTo(os.Stdout, 1)
}
Note that not all blocking is bad. When a goroutine blocks, the underlying worker thread simply switches to another goroutine. So blocking in the cooperative Go environment is very different from blocking on a mutex in a non-cooperative systems (e.g. typical C++ or Java threading libraries, where blocking leads to thread idling and expensive thread context switches). To give you some feeling, let’s consider some examples.
Blocking on a time.Ticker is usually OK. If a goroutine blocks on a Ticker for 10 seconds, you will see 10 seconds of blocking in the profile, which is perfectly fine. Blocking on sync.WaitGroup is frequently OK. For example, is a task takes 10 seconds, the goroutine waiting on a WaitGroup for completion will account for 10 seconds of blocking in the profile. Blocking on sync.Cond may or may not be OK, depending on the situation. Consumer blocking on a channel suggests slow producers or lack of work. Producer blocking on a channel suggests that consumers are slower, but this is frequently OK. Blocking on a channel-based semaphore shows how much goroutines are gated on the semaphore. Blocking on a sync.Mutex or sync.RWMutex is usually bad.
并不是所有的阻塞都是不利的。當1個goroutine阻塞時,底層的工作線程就會簡單地轉換到另外一個goroutine。所以Go并行環境下的阻塞與非并行環境下的mutex的阻塞是有很大不同的(例如典型的C++或Java線程庫,當產生阻塞時會引發線程空載和高昂的線程切換)。幾個例子:
在time.Ticker上產生的阻塞通常是可行的,如果1個goroutine阻塞Ticker超過10秒,你將會在profile中看到有10秒的阻塞,這是很好的。產生在sync.WaitGroup上的阻塞常常也是可以的,例如,1個任務需要10秒,等待WaitGroup完成的goroutine會在profile中生成10秒的阻塞。產生在sync.Cond上的阻塞可好可壞,取決于情況不同。消費者在通道阻塞表明生產者緩慢或不工作。生產者在通道阻塞,表明消費者緩慢,但這通常也是可以的。在基于channel-based semaphore產生阻塞,表明了限制在這個信號量上的goroutine的數量。產生在sync.Mutex或sync.RWMutex上的阻塞通常是不利的。你可以在可視化進程中,在pprof中使用–ignore標志來從profile中排除已知的無關阻塞。
goroutinue profile
goroutine profile: total 10003 10000 @ 0x42ca8a 0x42cb7e 0x40569f 0x4053b5 0x401042 0x45b001
The goroutine profiler simply gives you current stacks of all live goroutines in the process. It can be handy to debug load balancing issues (see Scheduler Trace section below), or to debug deadlocks. The profile makes sense only for a running app, so go test does not expose it.
Note that goroutines in “syscall” state consume an OS thread, other goroutines do not (except for goroutines that called runtime.LockOSThread, which is, unfortunately, not visible in the profile). Note that goroutines in “IO wait” state also do not consume threads, they are parked on non-blocking network poller (which uses epoll/kqueue/GetQueuedCompletionStatus to unpark goroutines later).
goroutinue分析器簡單地提供給你當前進程中所有活躍的Go協程堆棧。它可以方便地調試負載平衡問題(參考下面的調度器追蹤章節),或調試死鎖。這個配置僅僅對運行的程序成心義,所以go test是沒用的。
syscall狀態的goroutinue將會消耗1個OS線程,而其他的Go協程則不會(除調用runtime.LockOSThreadd的goroutinue,不幸的是,它在profile中是不可見的)。一樣需要注意的是在IO wait狀態的goroutinue一樣不會消耗線程,他們停駐在非阻塞的網絡輪詢器(通常稍后使用epoll/kqueue/GetQueuedCompletionStatus來喚醒goroutines)。
Garbage Collector Trace
$ GODEBUG=gctrace=1 ./myserver
Then the program will print output similar to the following during execution:
gc9(2): 12+1+744+8 us, 2 -> 10 MB, 108615 (593983⑷85368) objects, 4825/3620/0 sweeps, 0(0) handoff, 6(91) steal, 16/1/0 yields gc10(2): 12+6769+767+3 us, 1 -> 1 MB, 4222 (593983⑸89761) objects, 4825/0/1898 sweeps, 0(0) handoff, 6(93) steal, 16/10/2 yields gc11(2): 799+3+2050+3 us, 1 -> 69 MB, 831819 (1484009⑹52190) objects, 4825/691/0 sweeps, 0(0) handoff, 5(105) steal, 16/1/0 yields
Let’s consider the meaning of these numbers. One line per GC is printed. The first number (“gc9”) is the number of GC (this is the 9-th GC since program start). The number in parens (“(2)”) is the number of worker threads participated in the GC. The next 4 numbers (“12+1+744+8 us”) mean stop-the-world, sweeping, marking and waiting for worker threads to finish, in microseconds, respectively. The next 2 numbers (“2 -> 10 MB”) mean size of live heap after the previous GC and full heap size (including garbage) before the current GC. The next 3 numbers (“108615 (593983⑷85368) objects”) are total number of objects in heap (including garbage) and total number of memory allocation and free operations. The next 3 numbers (“4825/3620/0 sweeps”) characterize sweep phase (of the previous GC): there were total 4825 memory spans, 3620 were swept on demand or in background, 0 were swept during stop-the-world phase (the rest were unused spans). The next 4 numbers (“0(0) handoff, 6(91) steal”) characterize load balancing during parallel mark phase: there were 0 object handoff operations (0 objects were handoff), and 6 steal operations (91 objects were stolen). The last 3 numbers (“16/1/0 yields”) characterize effectiveness of parallel mark phase: there were total of 17 yield operations during waiting for another thread.
每次GC輸出1行。
-
第1個數字(”gc9”)是GC的編號(這是從程序開始后的第9個GC),在括號中的數字(”(2)”)是參與GC的工作線程的數量。
-
隨后的4個數字(”12+1+744+8 us”)分別是工作線程完成GC的stop-the-world, sweeping, marking和waiting時間,單位是微秒。
-
接下來的兩個數字(”2 -> 10 MB”)表示前1個GC過后的活躍堆大小和當前GC開始前全部的堆(包括垃圾)的大小。
-
再接下來的3個數字 (”108615 (593983⑷85368) objects”)是堆中的對象總數(包括垃圾)和分配操作的內存總數和釋放操作的內存總數。
-
后面的3個數字(”4825/3620/0 sweeps”)表示sweep phase (of the previous GC):總共有4825個memory spans,3620立即或在后臺清除,0個在stop-the-world階段清除(剩余的是沒有使用的spans)。
-
再后面的4個數字(”0(0) handoff, 6(91) steal”)表示了load balancing during parallel mark phase:there were 0 object handoff operations (0 objects were handoff), and 6 steal operations (91 objects were stolen).
-
最后的3個數字(”16/1/0 yields”)表示了effectiveness of parallel mark phase:there were total of 17 yield operations during waiting for another thread.
Memory Allocator Trace
內存分配器跟蹤只是簡單地將所有的內存分配和釋放操作轉儲到控制臺。通過設置環境變量GODEBUG=allocfreetrace=1就能夠開啟該功能。輸出看起來像下面的內容:
tracealloc(0xc208062500, 0x100, array of parse.Node)
goroutine 16 [running]:
runtime.mallocgc(0x100, 0x3eb7c1, 0x0)
runtime/malloc.goc:190 +0x145 fp=0xc2080b39f8 runtime.growslice(0x31f840, 0xc208060700, 0x8, 0x8, 0x1, 0x0, 0x0, 0x0)
runtime/slice.goc:76 +0xbb fp=0xc2080b3a90 text/template/parse.(*Tree).parse(0xc2080820e0, 0xc208023620, 0x0, 0x0)
text/template/parse/parse.go:289 +0x549 fp=0xc2080b3c50 ... tracefree(0xc208002d80, 0x120)
goroutine 16 [running]:
runtime.MSpan_Sweep(0x73b080)
runtime/mgc0.c:1880 +0x514 fp=0xc20804b8f0 runtime.MCentral_CacheSpan(0x69c858)
runtime/mcentral.c:48 +0x2b5 fp=0xc20804b920 runtime.MCache_Refill(0x737000, 0xc200000012)
runtime/mcache.c:78 +0x119 fp=0xc20804b950 ...
The trace contains address of the memory block, size, type, goroutine id and the stack trace.
Scheduler Trace
調度器追蹤可以提供對 goroutine 調度的動態行動的內視,并且可以用來調試負載平衡和可擴大性問題。要啟用調度器追蹤,可以帶有環境變量 GODEBUG=schedtrace=1000來運行程序(這個值的意思是輸出的周期,單位是ms,這類情況下是每秒1次):
SCHED 1004ms: gomaxprocs=4 idleprocs=0 threads=11 idlethreads=4 runqueue=8 [0 1 0 3] SCHED 2005ms: gomaxprocs=4 idleprocs=0 threads=11 idlethreads=5 runqueue=6 [1 5 4 0] SCHED 3008ms: gomaxprocs=4 idleprocs=0 threads=11 idlethreads=4 runqueue=10 [2 2 2 1]
The first number (“1004ms”) is time since program start. Gomaxprocs is the current value of GOMAXPROCS. Idleprocs is the number of idling processors (the rest are executing Go code). Threads is the total number of worker threads created by the scheduler (threads can be in 3 states: execute Go code (gomaxprocs-idleprocs), execute syscalls/cgocalls or idle). Idlethreads is the number of idling worker threads. Runqueue is the length of global queue with runnable goroutines. The numbers in square brackets (“[0 1 0 3]”) are lengths of per-processor queues with runnable goroutines. Sum of lengths of global and local queues represents the total number of goroutines available for execution.
-
第1個數字(”1004ms”)是從程序開始后的時間。
-
Gomaxprocs 是當前的 GOMAXPROCS 值。
-
Idleprocs 是空閑的處理器數(剩下的在履行 Go 代碼)。
-
Threads 是調度器產生的worker線程總數(線程有3種狀態:履行 Go 代碼(gomaxprocs-idleprocs),履行 syscalls/cgocalls,閑置)。
-
Idlethreads是閑置的worker線程數。
-
Runqueue 是可運行的 goroutine 的全局隊列長度。方括號中的數字(”[0 1 0 3]”)是每一個processor的可運行的 goroutine 的隊列的長度。全局和局部隊列的長度總和表示可履行的 goroutine 的總數。
當1個程序不與 GOMAXPROCS 成線性比例和(或)沒有消耗100%的CPU時間(top 命令),Scheduler Trace就顯得非常有用。
理想的情況是:所有的處理器都在繁忙地運行 Go 代碼,線程數公道,所有隊列都有充足的任務且任務是公道均勻的散布的:
gomaxprocs=8 idleprocs=0 threads=40 idlethreads=5 runqueue=10 [20 20 20 20 20 20 20 20]
不好的情況是上面所列的東西并沒有完全到達。例以下面這個演示,沒有足夠的任務來保持所有的處理器繁忙:
gomaxprocs=8 idleprocs=6 threads=40 idlethreads=30 runqueue=0 [0 2 0 0 0 1 0 0]
你可使用 goroutine profile來了解哪些goroutine塊處于任務短缺狀態。注意,只要所有的處理器處于忙綠狀態,負載失衡就不是最壞的,它只會致使適度的load balance開消。
Memory Statistics
Go runtime exposes coarse-grained memory statistics viaruntime.ReadMemStatsfunction. The statistics are also exposed vianet/http/pprofat the bottom ofhttp://myserver:6060/debug/pprof/heap?debug=1. The statistics are described here.
# runtime.MemStats # Alloc = 92936 # TotalAlloc = 92936 # Sys = 1740800 # Lookups = 3 # Mallocs = 247 # Frees = 11 # HeapAlloc = 92936 # HeapSys = 753664 # HeapIdle = 401408 # HeapInuse = 352256 # HeapReleased = 0 # HeapObjects = 236 # Stack = 294912 / 294912 # MSpan = 7040 / 16384 # MCache = 4800 / 16384 # BuckHashSys = 2074 # NextGC = 4194304 # PauseNs = [0 0 0 0 0 0 0 0 0 0 0 0 0 0 0 0 0 0 0 0 0 0 0 0 0 0 0 0 0 0 0 0 0 0 0 0 0 0 0 0 0 0 0 0 0 0 0 0 0 0 0 0 0 0 0 0 0 0 0 0 0 0 0 0 0 0 0 0 0 0 0 0 0 0 0 0 0 0 0 0 0 0 0 0 0 0 0 0 0 0 0 0 0 0 0 0 0 0 0 0 0 0 0 0 0 0 0 0 0 0 0 0 0 0 0 0 0 0 0 0 0 0 0 0 0 0 0 0 0 0 0 0 0 0 0 0 0 0 0 0 0 0 0 0 0 0 0 0 0 0 0 0 0 0 0 0 0 0 0 0 0 0 0 0 0 0 0 0 0 0 0 0 0 0 0 0 0 0 0 0 0 0 0 0 0 0 0 0 0 0 0 0 0 0 0 0 0 0 0 0 0 0 0 0 0 0 0 0 0 0 0 0 0 0 0 0 0 0 0 0 0 0 0 0 0 0 0 0 0 0 0 0 0 0 0 0 0 0 0 0 0 0 0 0 0 0 0 0 0 0 0 0 0 0 0 0] # NumGC = 0 # DebugGC = false
Some of the interesting fields are:
-
HeapAlloc - current heap size.
-
HeapSys - total heap size.
-
HeapObjects - total number of objects in the heap.
-
HeapReleased - amount of memory released to the OS; runtime releases to the OS memory unused for 5 minutes, you can force this process withruntime/debug.FreeOSMemory.
-
Sys - total amount of memory allocated from OS.
-
Sys-HeapReleased - effective memory consumption of the program.
-
StackSys - memory consumed for goroutine stacks (note that some stacks are allocated from heap and are not accounted here, unfortunately there is no way to get total size of stacks (https://code.google.com/p/go/issues/detail?id=7468)).
-
MSpanSys/MCacheSys/BuckHashSys/GCSys/OtherSys - amount of memory allocated by runtime for various auxiliary purposes; they are generally not interesting, unless they are too high.
-
PauseNs - durations of last garbage collections.
profile使用方式匯總
httpServer pprof
如果你的go程序是用http包啟動的web服務器,你想查看自己的web服務器的狀態。這個時候就能夠選擇net/http/pprof。你只需要引入包_ “net/http/pprof”,然后就能夠在閱讀器中使用http://localhost:port/debug/pprof/直接看到當前web服務的狀態,包括CPU占用情況和內存使用情況等。
package main import _ "net/http/pprof" import "net/http" import "fmt" var c chan struct{} = make(chan struct{}) func f() {
<-c } func main() { for i := 0; i < 10000; i++ { go f()
}
fmt.Println("Start httpServer at http://localhost:6060")
http.ListenAndServe(":6060", nil)
}
Use the pprof tool to look at the heap profile:
$ go tool pprof http://localhost:6060/debug/pprof/heap
Or to look at a 30-second CPU profile:
$ go tool pprof http://localhost:6060/debug/pprof/profile
Or to look at the goroutine blocking profile, after callingruntime.SetBlockProfileRatein your program:
$ go tool pprof http://localhost:6060/debug/pprof/block
Or to collect a 5-second execution trace:
$ wget http://localhost:6060/debug/pprof/trace?seconds=5
To view all available profiles, open http://localhost:6060/debug/pprof/ in your browser.
service pprof
如果你的go程序不是web服務器,而是1個服務進程,那末我們可以將profile信息輸出到閱讀器或文件。
package main import ( "fmt" "net/http" "runtime/pprof" ) var c chan struct{} = make(chan struct{}) func f() {
<-c } func handler(w http.ResponseWriter, r *http.Request) {
w.Header().Set("Content-Type", "text/plain")
p := pprof.Lookup("goroutine")
p.WriteTo(w, 1)
} func main() { for i := 0; i < 10000; i++ { go f()
}
http.HandleFunc("/", handler)
fmt.Println("Start httpServer at http://localhost:6060")
http.ListenAndServe(":6060", nil)
}
訪問http://localhost:11181/,我們就能夠得到全部goroutine的信息。也能夠將profile信息寫入文件或標準輸出:
package main
import ( "fmt" "os" "runtime/pprof" )
func main() {
fmt.Println("--lookup heap---------------")
p4heap := pprof.Lookup("heap")
p4heap.WriteTo(os.Stdout, 1)
fmt.Println("--lookup threadcreate-------")
p4thread := pprof.Lookup("threadcreate")
p4thread.WriteTo(os.Stdout, 1)
fmt.Println("--lookup block--------------")
p4block := pprof.Lookup("block")
p4block.WriteTo(os.Stdout, 1)
}
go test
go test內建了多個flag,用于輸出profile:
$ go help testflag
The following flags are recognized by the 'go test' command and control the execution of any</